
HVAC technician productivity is how much sold, finished, paid-for work a tech turns out of each paid hour. It is not how busy the truck looks. Most of the gap between an average shop and a great one is not tech skill. It is drive time, parts runs, callbacks and dispatch gaps, and those are fixable. Fixing them also takes the right people on the right trucks, which is why we built HVAC Mafia as a trade-only job board and community where contractors and techs find each other.
This guide is for techs who want to know how they are judged, and for service managers and owners who do the judging. We will keep the math simple, use real benchmarks, and show what moves the numbers.
TL;DR
- Productivity, utilization and efficiency are three different numbers. Utilization is billable hours divided by paid hours. Efficiency is how your actual time compares to the time the job was supposed to take. Productivity is the output you get per paid hour.
- A 2026 report on 300 HVAC companies found about 5.7 of a tech’s 8.8 paid hours a day are billable, roughly 65%. The rest goes to travel, waiting, paperwork and callbacks.
- The biggest wins are logistics: tighter routes, standard truck stock, fewer callbacks and fewer shop minutes.
- Read the numbers in pairs. A tech with sky-high utilization can still be your least productive one.
- Good productivity is also a hiring and retention issue. Techs who see fair measurement and good pay stay.
Table of Contents
- What productivity, utilization and efficiency actually mean
- How to calculate it: a worked example
- Benchmarks worth knowing
- What actually drains a tech’s day
- What managers can do this month
- How to evaluate performance without gaming the numbers
- If you are a tech: how to raise your own numbers
- If you are a manager: productivity starts with the people
- Our perspective
- Hire the techs who make the numbers work
- FAQ
- Sources
What productivity, utilization and efficiency actually mean
People use these words as if they were one thing. They are not, and mixing them up leads to bad coaching.
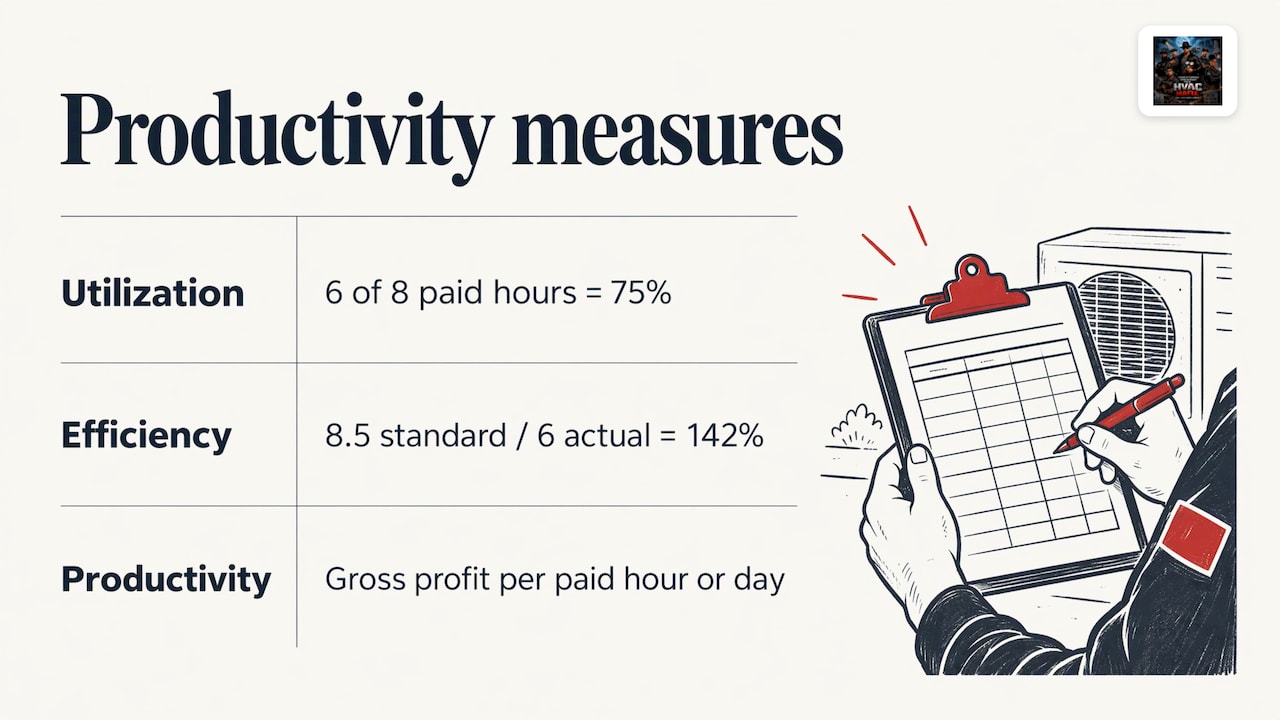
Utilization answers: was the day sold? Take billable hours, divide by total paid hours, multiply by 100. A tech with 6 billable hours in an 8-hour day is at 75%.
Efficiency answers: how well did the tech use the time on the job? It compares actual time to the standard time for that work. If a tech finishes work that was priced at 8.5 hours in 6 hours on the clock, that is about 142% efficiency. It rewards good diagnostics, the right tools and the right parts on the truck.
Productivity answers: did that time produce results? Many shops measure it in gross profit per paid hour or per day, not revenue alone. A tech can be on tools 90% of the day and still deliver little if the jobs were low value or poorly planned.
The three connect. Utilization is mostly the office’s job: dispatch, routing, scheduling. Efficiency is mostly the tech’s craft, supported by the price book and truck stock. Productivity is the result of both, plus how the work is sold.
Why “busy” is not the same as productive
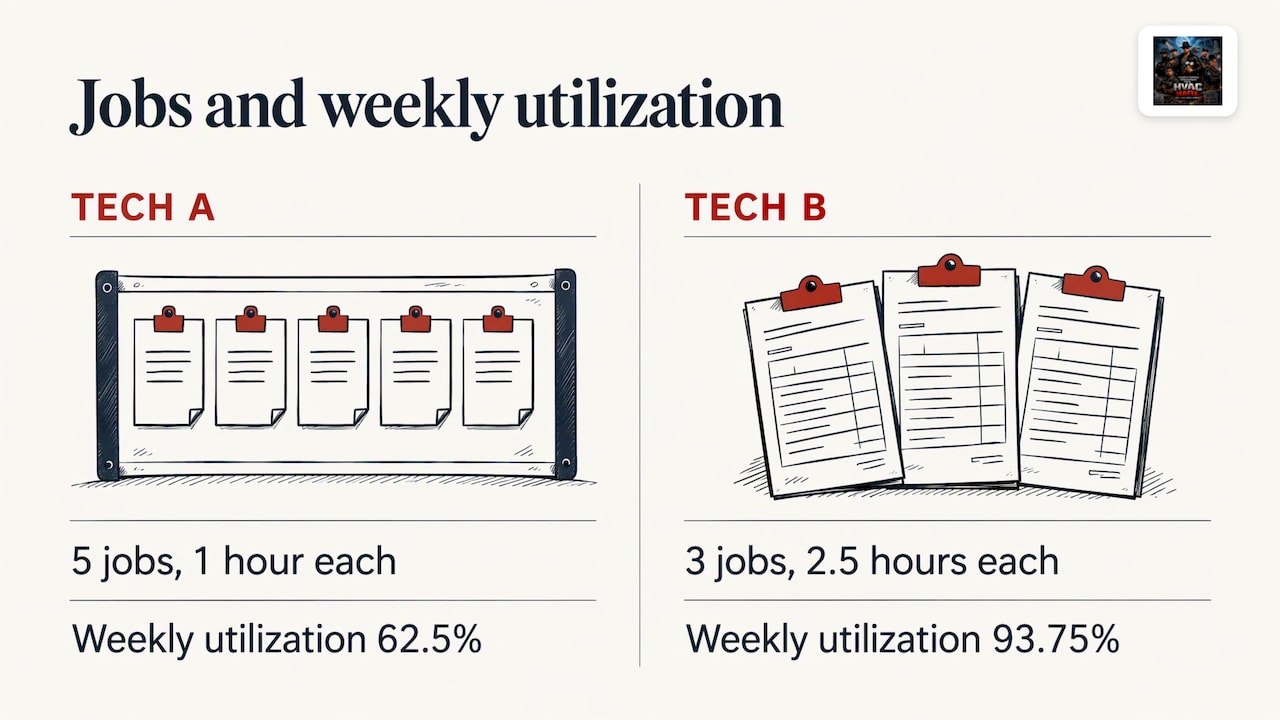
Here is a simple example. Tech A runs five one-hour jobs in a day. Tech B runs three jobs that each take two and a half hours. Tech A looks busier on the dispatch board, but job complexity changes what the numbers mean. A PTC walkthrough shows a five-job tech landing around 62.5% weekly utilization while a three-job tech with long repairs reaches 93.75%. Jobs per day alone tells you very little.
How to calculate it: a worked example
Pull one tech’s week and do the math in four lines.
- Paid hours: 40.
- Billable hours: 28.
- Utilization: 28 ÷ 40 × 100 = 70%.
- Output: gross profit for the week divided by 40 paid hours, or by five days if you track per man-day.
Then add efficiency: if the jobs closed that week were priced at 32 standard hours and the tech spent 28 on them, efficiency is 114%.
Now compare to the field. The Field Promax report covered by ACHR News looked at more than 10,000 data points across 300 HVAC companies and found 5.7 of 8.8 paid hours per day were billable, about 65%. By that yardstick, 70% is solid, not a problem.
Older industry data shows the same pattern. The ACCA, the contractor trade association, has noted that non-billable time averages about 50% for service technicians, counting shop time, travel between jobs, holidays, callbacks, no-shows, warranty work and errands. Definitions differ between shops, so compare your own tech to your own history first, and to outside numbers second.
Benchmarks worth knowing
Use these as reference points, not report cards. Check the date and the type of shop each one comes from.
| Measure | Benchmark | Source |
|---|---|---|
| Billable share of paid day | About 65% (5.7 of 8.8 hours) | ACHR News, June 2026 |
| Non-billable time, best-in-class contractors | 5% to 10% per year | MCAA 2022 benchmark survey |
| Residential service tech annual sales | At least $250,000 at 63%+ gross margin | HVACR Business, 2018 |
| Gross profit per service tech per day | $630 | HVACR Business, 2018 |
| Callbacks | Under 5%, with 1% best in class | HVACR Business, 2018 |
| Installer gross profit per day | $825 per installer, $1,400 per two-person crew | HVACR Business, 2018 |
Two cautions. The MCAA survey covers service contractors that tend to be mechanical and commercial, so a residential replacement shop will look different. And the HVACR Business figures are from 2018, so labor rates and ticket sizes have moved. Treat them as a structure for your own targets: sales, margin, billable time and callbacks.
The same HVACR Business piece describes a typical residential day as four service calls at a $250 average invoice. If your techs run three calls at $400, you may be more productive than the benchmark even though the call count looks low.
What actually drains a tech’s day
The Field Promax findings, as reported by The Hardwire News, point to the same five culprits: travel, dispatch gaps, paperwork, waiting and callbacks. Callbacks hurt most because the company pays for the second trip and usually cannot bill for it.
In plain terms:
- Drive time. Jobs scattered across a metro area burn hours that nobody pays for.
- Parts runs. Every run to the supply house is time off the unit.
- Dispatch gaps. A tech finishes at 2:10 and the next job is at 3:30.
- Paperwork. Notes, photos and invoices done at the end of the day, or at home.
- Callbacks. A repair that did not hold. The first-visit fix rate matters because a miss costs a truck roll, a customer’s patience and a second tech hour.
That last one is often a systems problem, not a skill problem. Missing information on the work order, a part not on the truck, or a poor handoff can all produce a callback from a good tech.
What managers can do this month
The ACHR report lists concrete fixes. Here is the short version, with why each works.
- Group jobs by neighborhood and cap drive time between appointments at 30 minutes. Less windshield time, more wrench time.
- Standardize truck stock. When any truck can take any call, one missing common part does not wreck two routes.
- Start and end the day near home. Put each tech’s first and last jobs closest to where they live.
- Hold back about 5% of each day for emergencies. A schedule booked to 100% breaks at the first no-show.
- Run separate dispatch boards for installs and service. The report gives an example of two installs and four service calls per truck.
- Trim shop time. Cutting 15 minutes twice a day adds up to about 120 hours per tech per year.
- Set a 30-minute weekly truck maintenance window so a bad truck does not eat a billable morning.
The report also estimates that cutting unbillable time by 30 minutes a day saves $15 a day for a tech earning $30 an hour, about $39,000 a year across a 10-tech shop. It is an estimate, but the point holds: small minutes compound.
HVACR Business adds two ideas worth stealing. Keep a customized inventory list for each tech to cut supplier runs, and keep unbillable time under 25%. It also suggests a weekly training session on diagnostics and catching failures before they happen, and a required tool list for each job function so nobody is missing a tool at the customer’s door.
Measure with the right tools, but not just any tools
You cannot fix what you cannot see. Time data does not need to be fancy. A shop that wants to understand where paid hours go can start with clean clock-in data, and this look at time tracking return on investment for billable field crews shows how that data turns into payback. On the front end, a clear HVAC quote template gets estimates out the door faster, which keeps admin time from eating the end of the day.
How to evaluate performance without gaming the numbers
Every number you put on a board becomes a target, and targets get gamed. A tech measured only on utilization will take easy jobs and avoid the long diagnostics. A tech measured only on revenue will oversell. Some habits that hold up:
- Read metrics in pairs. Utilization with first-time fix rate. Revenue per tech with callback rate. Average ticket with customer rating.
- Use the same measures for every tech over the same period. Weekly reviews work better than a surprise at the end of the month.
- Separate what the tech controls from what the office controls. Utilization is largely a scheduling outcome. Do not coach a tech on a number that dispatch drives.
- Show techs their own scorecard. People improve when they can see the gap.
- Pay for gross profit with quality guards. Compensation that rewards billable hours far more than unbillable ones lines up incentives, as HVACR Business suggests, but pair it with callback and customer-rating checks.
A reasonable starting scorecard for a service tech: utilization, first-time fix rate, callback rate within 30 days, average ticket, revenue or gross profit per paid hour, and customer rating. Six numbers is plenty.
If you are a tech: how to raise your own numbers
You do not control the schedule, but you control more than you think.
- Own your truck stock. Ask for a stock list based on the parts you actually use. Review it monthly.
- Diagnose before you pull parts. Many callbacks start with a rushed diagnosis. Slow down on the first ten minutes and save the second trip.
- Write good notes. The next tech, or you in three weeks, should not have to start from zero.
- Learn the equipment you see most. Skill gaps on specific equipment show up in repeat visits. Training closes them, and training is how you move up. Our guide to the HVAC service technician career covers pay, path and next steps.
- Know what the shop measures. If you are judged on a number, ask how it is built and what is in it.
One more point. Productivity targets matter most when the shop pays fairly for hitting them. If you are strong on the numbers, you have leverage. Our look at commercial HVAC salaries can help you see what that is worth.
If you are a manager: productivity starts with the people
All the routing and software in the world will not fix a truck without a tech. Service managers tell us the same thing: the numbers sag when a position stays open, when a good tech leaves, or when a new hire has no ramp. Hiring and keeping the right people is part of productivity.
That is also where the pay, culture and advancement conversation lands. Techs with choices look at how a shop schedules, what it pays, and whether the equipment and truck stock let them do good work. If you are stepping into this role, HVAC service manager jobs: pay, path and how to hire walks through what the job demands.
Our perspective
We have spent a lot of years in this trade, and the founder of HVAC Mafia spent 36 of them in it, including running a dealership. Here is what we keep coming back to.
Productivity is not a tech problem. It is a shop problem that shows up on a tech’s timecard. A great tech on a bad route, with a half-stocked truck and no dispatch plan, looks average. A good tech with a clear schedule, the right parts and a boss who coaches looks like a star.
The other half is people. You cannot schedule your way out of a staffing hole. And techs who feel measured fairly and paid honestly stay. That is why we built a place where verified trade professionals talk straight about pay, careers and what makes a contractor worth working for.
For contractors, that means your openings reach a trade-only audience of nearly 100,000 HVAC followers, and applications go straight to your own hiring system. For techs, it means free membership, real openings from real contractors, and forums where other techs tell you how it is.
Build a career, not just another paycheck. Build a shop people want to work for. The numbers follow.
the author
Hire the techs who make the numbers work
If your productivity problem is an empty seat, or a seat that keeps turning over, we can help. Job postings on HVAC Mafia run $199 per month per position on the Standard plan, $149 per month per position on the Annual plan, and from $99 per month per position on Enterprise. You can see the options on our job posting plans page.
Want techs to see what your shop is really like, including culture, pay and benefits? A Company Spotlight profile is $149 per month or $1,699 per year.

Techs and apprentices, you never pay. Join as a member to see job openings from contractors across the country. Openings are hidden from non-members.
FAQ
What is a good productivity percentage for an HVAC technician?
It depends on how your shop defines it. Billable hours divided by paid hours is the most common definition, and a 2026 industry report found the average is about 65%. HVACR Business has recommended keeping unbillable time under 25%, which means 75% utilization or better. Use your own shop’s history as the first benchmark.
What is the difference between efficiency and productivity?
Efficiency compares the time a tech actually spent on a job with the standard time for that work. Productivity measures what that time produced, often as gross profit per paid hour. A tech can be efficient on low-value work and still have low productivity.
How do you calculate HVAC technician utilization?
Divide billable hours by total paid hours and multiply by 100. A tech with 28 billable hours in a 40-hour week is at 70%. Drive time, shop time, parts runs and callbacks are what usually sit in the non-billable column.
What lowers technician performance the most?
Travel, dispatch gaps, paperwork, waiting and callbacks are the main drains, according to coverage of the Field Promax report. Callbacks are especially costly because the second trip is usually not billable. Missing parts and unclear work orders cause many of them.
How can a service manager improve technician performance?
Start with the schedule and the truck: group jobs by area, cap drive time, standardize stock and leave room for emergencies. Then review a small set of metrics weekly with each tech, and read them in pairs. Fill open positions so your best techs are not carrying the load.
Sources
- Field Promax report coverage, ACHR News (June 2026)
- The Hardwire News on billable hours and the Field Promax report (July 2026)
- ACCA HVAC Blog: Technician Productivity Is Moving to the Forefront (2017)
- MCAA: The MSCA 2022 Benchmark Survey results
- HVACR Business: Increase Your Service Technician Revenue (2018)
- PTC: How to Maximize Technician Productivity and Utilization (2024)
- Time tracking ROI for billable teams and field crews
- Free HVAC quote template